Distribution of reported offering amounts
2026-10-01–2026-10-31 · 5780 stored accessions · 5520 distinct CIKs.
Calculated 2026-11-02T09:25:55.870032+00:00. These are computed observations, not an independently reviewed editorial edition.
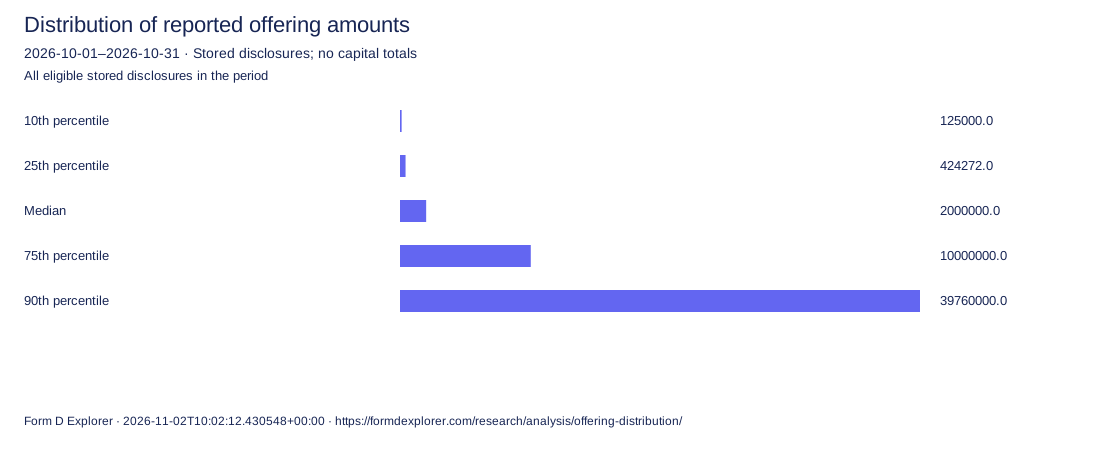
| Measure or category | Value |
|---|---|
| 10th percentile | 125,000 |
| 25th percentile | 424,272 |
| Median | 2,000,000 |
| 75th percentile | 10,000,000 |
| 90th percentile | 39,760,000 |
| Usable numeric disclosures | 2,477 |
| Reported zero | 11 |
| Unavailable or invalid | 1,200 |
Sample and calculation
Unique stored accessions; issuers are distinct CIKs. Counts describe this dataset, not the entire market. No monetary amounts are summed. Only initial notices are used for these distributions. Linear quantiles use rank (n−1)×p; numeric zero is included and missing or negative values are excluded. Units are investor counts or source-reported USD, as labelled.
Display values round to two decimals where needed. Downloads retain the calculation values.
- Eligible
- 3,677
- Usable
- 2,477
- Unavailable
- 1,200
- Bounded
- No
Traceable sample sources
The following are source examples, not a certification of every observation.
- 0002163169-26-000001 · 2026-10-30 · Inspect fields
- 0002163135-26-000001 · 2026-10-30 · Inspect fields
- 0002163119-26-000001 · 2026-10-30 · Inspect fields
- 0002163097-26-000001 · 2026-10-30 · Inspect fields
- 0002163060-26-000002 · 2026-10-30 · Inspect fields